
Unbiased data is a dangerous illusion
Institutions shame us when we show biased statistics and downplay bias in their own because if everyone knew that data systems carry political agendas, we'd be able to see how they're harming us.

Hi everyone! Thanks for being here. I hope you’re enjoying a peaceful transition into winter, cozying up by a fire or relishing a warm cup of tea wherever you are. I am eternally grateful for your patience and willingness to stay with this writing endeavor as months pass without any word from me!
I am still thinking of you all and am finding new ways to be in conversation through this channel. Please drop me a note if you’re interested in specific data justice ideas or theories that you’d like me to explore next! Until next time☕
This has been a generative year for the People’s Data Project! I started out with a concept of data rights education and a gut feeling that the people who I work with in my community could benefit from understanding how systems of power weaponize our data against us, hard-coding oppression into every area of our politicized lives.
When I started talking to my friends/experts about how I should craft lessons or workshops around data rights, I used references from groups like Civic Switchboard who work to connect local libraries to community information networks in cities across the country. Civic Switchboard hosts workshops to help people understand the basics of civic data, for example by helping people create datasets from their own experiences.
Thinking about data creation, I started to wonder, what is it about creating your own dataset that invites you to better understand issues of data justice? What does the process of creating your own dataset actually feel like?
People can feel the difference between data that reflects their own experience and data that reflects someone else’s perspective from above.
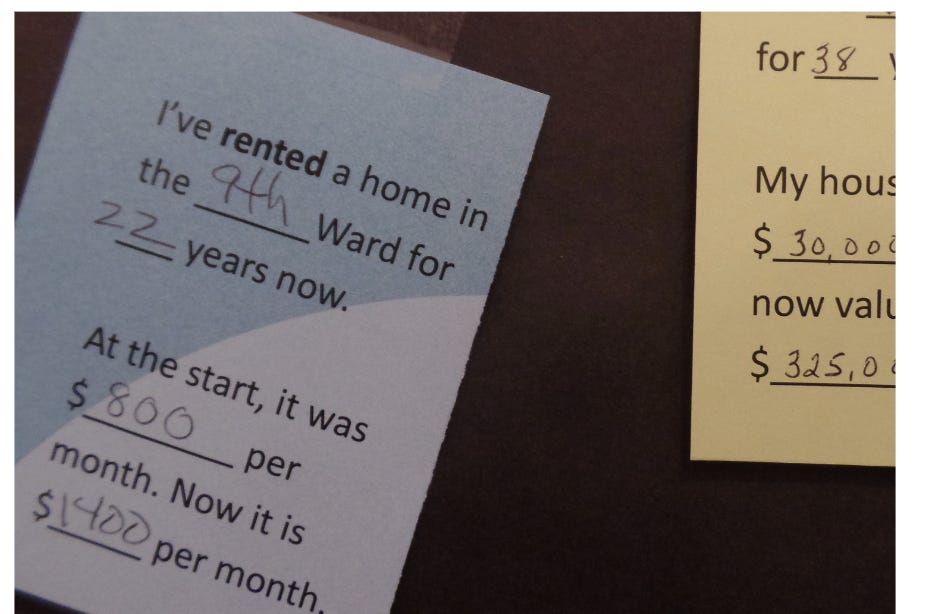
A year ago, the NOTICE Coalition, which I wrote about in my previous dispatch, held its first Houston convening for organizers fighting back against surveillance in schools. The gathering started with a Habitat Walk with local community organizer and artist Eddie “Inspire” Garcia who led us through Tony Marron Park on the banks of Buffalo Bayou.
Eddie helped us identify native trees, plants, and creatures and also pointed out the looming golf courses, apartment complexes, and industrial zones on the peripheries of the beautiful views, threatening the housing security and health of the people living in Second Ward.
After the walk, I asked participants to think about what they saw and felt on the walk and to describe it. Some people mentioned the feeling of the wind, the unexpected views of construction on the fenceline of the park, garbage on the ground, milkweed, butterflies, native trees, and boats passing by on the water. We talked about how if we had to describe the park in data, we might try to find ways to capture the wind speeds or air quality, the number of native vs. invasive species present, the registrations of boats or barges passing by on the water.
Then, I asked people to think about how someone viewing the park through a surveillance device might describe it. They might be using cameras, so they’d be more interested in the number of people biking or walking on trails rather than observing the plant life alongside them. They might use sound recording devices so they’d be more interested in the decibel counts or noises from construction rather than the soft flow of the water.
People immediately noticed the disconnect between the park they felt and experienced and the park the way it would be viewed from above. That day planted a seed in my mind, what if people could collect or describe objects they picked up from their own explorations of a place, and then use that to create their own analog dataset about a place in their community. I created an analog dataset of my own to illustrate this concept and planned to use it for my workshop at the Twin Cities Innovation Alliance’s annual convening in July of this year.
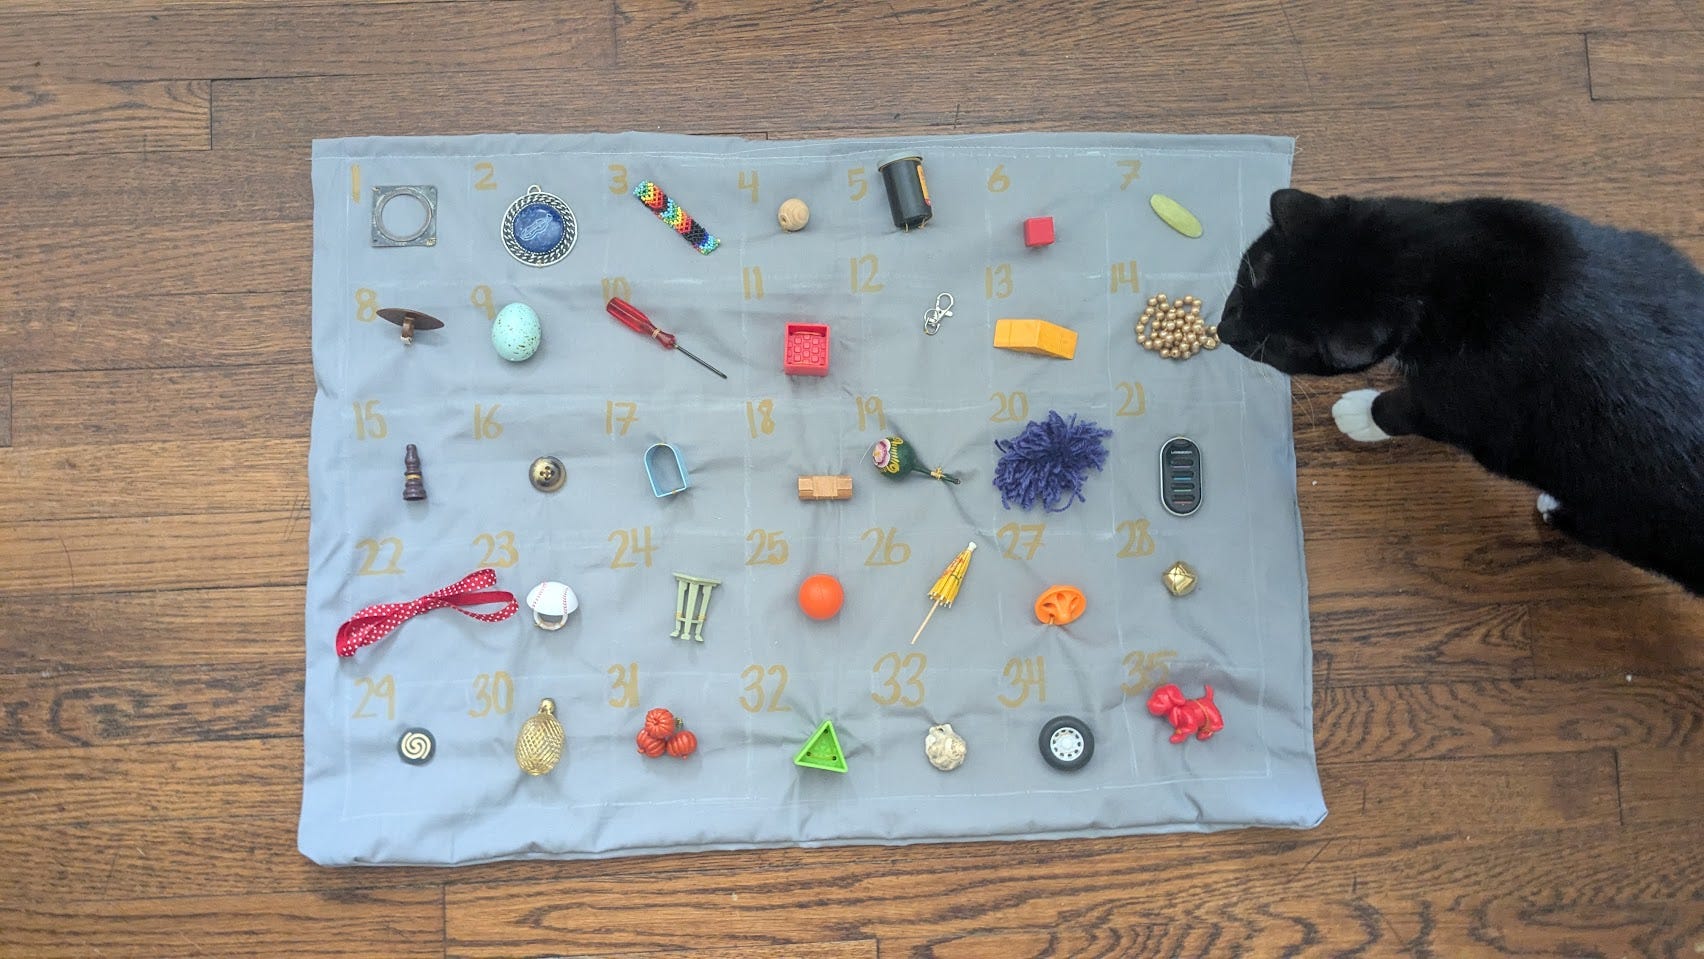
In my data bias workshop, I ask participants to create their own data table to capture descriptions of the numbered objects sewn onto my analog dataset. In essence, they are observing objects represented in the physical world and creating a summary dataset to be able to then describe the objects to the group.
Each participant is given their own table and encouraged to work alone to define the fields and determine which unique identifiers will ensure that they can differentiate between the objects in their table later on. Some people give the objects names while other people rely on their associated numbers written onto the cloth, but everyone is free to choose their own system of arranging the data.
The point is exactly in that subtle difference. From the same set of 35 simple objects, five people can create completely unique datasets depending on their perspectives or interests. Participants are sometimes shocked to find exactly how different their perspectives are. One person approached the objects as clutter in her home and classified them by how likely she’d be to throw them away while another categorized the objects by choking hazard, thinking about her toddler at home.
Made real, bias becomes an obvious fact, inherent in any data creation process. And after talking about it for a few minutes, people start to ask the same questions: Why are governments and scientific institutions so quick to tell us that our data is biased (or inadequate or insufficiently rigorous), when it’s so glaringly obvious that theirs must be too? Once we start thinking of “bias” as just a version of “perspective” — recognizing that it is harmless on its own — we can see that unbiased data is ultimately an illusion.
We’ve been taught to feel shame about bias because systems of power benefit from the illusion of “unbiased data.”
When I made this point in front of a room of environmental scientists at the Environmental Data and Mapping Symposium in Houston this past July, I could feel the whole room almost jump out of their seats in a collective, “Yes!”. I wondered later, how many scientists have gone through their whole careers in academia fearing the appearance of bias, trying to minimize it through layers of statistical methods, running from the reality of it at every turn?
Hazel Tohe was on that panel with me. She helped create the Dine’-Centered Research and Evaluation Model and leads efforts to research environmental issues affecting people in Navajo Nation, using Indigenous research methods built on Dine’/Navajo epistemology. For Hazel, presenting data and research with a perspective that exists in opposition to colonial research practices is the entire point. It requires not only an “acknowledgement of bias” as scientists would say, but a loud, affirmative declaration of the Dine’ lens that guides all of her work.
When you have a cultural foundation that allows you to approach research with specific values and goals connected to the livelihood of your community, your bias, which would be described as a an “error” within colonial statistical methods, becomes a perspective that aligns your work to a different compass. Hazel writes, their purpose is “to strive for a life of health, balance and prosperity, and to nurture a consciousness based on our understanding of our relationship to one another and all life.”
So, then, what’s happening on the other side? In the last few years of my time working with state and local governments on data policy and open data programs, I was interested in helping data teams implement bias assessments and stronger metadata practices to ensure that agency data staff were trained in how to acknowledge and document bias in the datasets that they collected and created.
Government case managers, data analysts, and software engineers make dozens of decisions about how to collect the information that’s held in any given dataset. They decide how to word the questions behind the information (think: “were you late on your payments?” vs. “when did you submit your payment?”).
These decisions can have long-term effects. I’ve seen multiple cases where policies change and all of a sudden it doesn’t matter if people are behind on their payments anymore, late fees are forgiven. But the software is only coded to collect data on whether payments are late, not what date the payment was actually made. All of a sudden the data is useless because it was designed for a different political priority.
Consider a corporate example: An employer who plans to punish people for being late to work will only be interested in tracking whether a worker was LATE or NOT LATE, which inserts a bias into the data that sees lateness as a bad thing. Their goal is to punish workers for their mistakes, which is reflected in how the data is collected. So by looking at the metadata — the data about the data, the definitions and questions behind it — we can see the employer’s perspective and their values related to issues of labor rights and capitalism.
Based on this example, you can see why an employer holding this perspective would want to hide it. It’s ugly. They’d want you to believe that their perspective is the only perspective, and they’d say that the data is essential for company performance, no questions asked, no data rights necessary. But if we can start to look for the data around the data, or behind it, we can have more insight into the perspectives of the people who craft the data, and therefore their positionality. And this has been my biggest lesson to-date.
Bias is an entry point to talking about data justice because it exposes positionality.
Most people I talk to about data rights or data justice think I’m talking about forcing organizers to use AI or other mess like that. People aren’t used to thinking about the power dynamics behind the data systems that increasingly govern our lives.
And honestly (very honestly) many of the projects I’ve come across in civic tech or open data world that attempt to work with “communities” don’t seek to grapple with any real world power dynamics in data or technology systems. They stay in the comfortable zone of diversity and inclusion, increasing opportunity for a more diverse range of people to participate in the existing systems of power that surround technology and data. This is an unfortunate manifestation of a de-politicized liberal agenda in spaces often said to be radically futurist or democratizing technology.
Examining the bias behind data systems is the first time most people think about the potential that the data we see or that is circulated about us in data markets is actually extremely biased to reinforce a capitalist, patriarchal, racialized, imperialist worldview.
It’s easy enough for us who work on data in our own communities to name our biases, we can examine our identities and positions and state the intentions behind why we are collecting data to serve our communities. It may not be perfect, but it is honest to where we are and we can acknowledge that data emerges from our own specific positionality and perspectives.
But what if we asked governments, corporations, and academic institutions to do the same thing? What if they had to name the values behind why they are asking for our information and tell us what they plan to do with it? What if they had to be honest about the impacts of their data collection on our lives?
I have a hunch (based strongly on my own experience) that if we start asking these questions, we will start to see power dynamics emerge in real-time. I have asked them before, and the reality is that governments avoid these questions because they can. Local governments are not accountable to communities in how they collect or manage data. There is often no meaningful consent when data is collected, it’s mandatory to provide if you want to receive any range of government services.
Without public pressure on our rights to our data, governments face no incentives to acknowledge that they are only collecting data on SNAP recipients’ incomes so that they can punish people who draw benefits when they are no longer eligible. Even if those families still need food, even when the cost of living has increased and being technically above the eligibility line doesn’t mean you can afford food for your family. The data says you are ineligible. And as they would tell it, the data doesn’t lie.